THE MARKET UNIVERSE EST. 2026
Discover the Stars
of the Stock Market.
Track, rank, and explore 100 leading US-listed stocks
through a new lens.
100 LISTED STOCKS12 SECTOR CONSTELLATIONSONE NEW PERSPECTIVE

OBSERVATORY / 001 ↗
NVDANVIDIA
-2.89%AAPLAPPLE
+0.15%MSFTMICROSOFT
+0.40%01 / 100 A UNIVERSE OF OPPORTUNITY
S&P 500 DAILY CLOSE
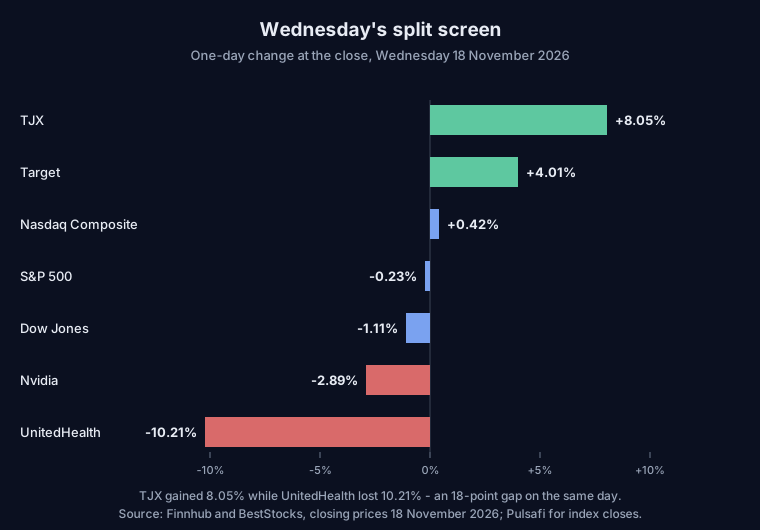
7,323.63-0.23%
2026-11-18 · Yahoo FinanceNASDAQ COMPOSITE DAILY CLOSE
24,429.88+0.42%
2026-11-18 · Yahoo Finance REPORTED CAP TOTAL
$61.08T100 STOCKS
Sum of reported values · share classes may overlap MARKET BREADTH
29 / 7129% advancing
● Advancing ● Declining
Featured articles and scanner
1 / 2
THE ORBITAL HIERARCHY
Top 100 Stocks100
Explore the brightest companies in the market universe.
Screens the Top 100 table. The strategy results below have separate controls and export.
Conditions combine with AND. Missing values are excluded when their filter is active. P/E uses the latest provider-reported TTM ratio where supplied; missing values remain excluded. Momentum uses 90 closing observations; RSI uses simple 14-period averages. Volatility is annualized from up to 63 log returns.
USD 100 stocks
| # | Stock name / Symbol | 7 Sessions | Save | |||||
|---|---|---|---|---|---|---|---|---|
| 01 | $352.45 | ↗ +0.15% | $5.11T | 33.4M | 100.0 | |||
| 02 | $508.29 | ↗ +0.40% | $3.76T | 21.3M | 99.0 | |||
| 03 | $150.96 | ↘ -2.89% | $3.75T | 343.0M | 98.0 | |||
| 04 | $282.44 | ↗ +0.80% | $3.44T | 27.1M | 97.0 | |||
| 05 | $279.20 | ↗ +0.58% | $3.41T | 21.2M | 96.0 | |||
| 06 | $267.74 | ↗ +3.82% | $2.79T | 40.8M | 94.9 | |||
| 07 | $143.50 | ↗ +1.27% | $1.92T | 85.2M | 93.9 | |||
| 08 | $362.62 | ↗ +0.81% | $1.87T | 12.0M | 92.9 | |||
| 09 | $354.05 | ↗ +3.64% | $1.63T | 25.9M | 91.9 | |||
| 10 | $616.38 | ↘ -0.40% | $1.58T | 10.3M | 90.9 | |||
| 11 | $383.72 | ↗ +0.95% | $1.50T | 26.7M | 89.9 | |||
| 12 | $1,382.75 | ↘ -2.32% | $1.33T | 2.6M | 88.9 | |||
| 13 | $863,450.00 | ↘ -1.71% | $1.30T | 242 | 87.9 | |||
| 14 | $574.62 | ↘ -2.07% | $1.30T | 5.4M | 86.9 | |||
| 15 | $127.36 | ↘ -0.13% | $1.01T | 27.9M | 85.9 | |||
| 16 | $122.47 | ↘ -0.11% | $893.66B | 12.1M | 84.8 | |||
| 17 | $324.11 | ↘ -1.77% | $876.32B | 6.7M | 83.8 | |||
| 18 | $530.14 | ↗ +5.31% | $833.18B | 33.5M | 82.8 | |||
| 19 | $705.27 | ↘ -1.00% | $806.05B | 26.9M | 81.8 | |||
| 20 | $415.22 | ↘ -0.37% | $751.81B | 7.1M | 80.8 | |||
| 21 | $160.58 | ↘ -3.97% | $682.21B | 17.3M | 79.8 | |||
| 22 | $272.70 | ↘ -2.15% | $671.21B | 7.9M | 78.8 | |||
| 23 | $643.37 | ↘ -0.37% | $562.41B | 2.4M | 77.8 | |||
| 24 | $1,395.27 | ↗ +0.88% | $533.08B | 1.3M | 76.8 | |||
| 25 | $286.01 | ↘ -2.33% | $517.75B | 4.8M | 75.8 |
Default: market capitalization · Size score: relative market-cap percentile ·
YOUR SYSTEMATIC UNIVERSE
Liquidity & Momentum Strategy 839
A daily liquidity screen ranked by 90-observation price momentum.
MARKET CAP ≥ $10B*AVG. DOLLAR VOLUME ≥ $50M/dayHISTORY ELIGIBILITY ≥ 126 observationsRANKING 90-observation return
| # | Stock name / Symbol | Daily close | Est. market cap* | Avg. dollar vol. | 90-obs. return | Eligible | Save |
|---|---|---|---|---|---|---|---|
| 1 | $196.79 | $83.68B | $3337.3M | +188.21% | 126+ days | ||
| 2 | $50.97 | $32.43B | $183.2M | +75.28% | 126+ days | ||
| 3 | $76.20 | $11.18B | $189.1M | +74.85% | 126+ days | ||
| 4 | $243.48 | $11.16B | $168.2M | +68.23% | 126+ days | ||
| 5 | $227.49 | $160.17B | $1297.4M | +66.03% | 126+ days | ||
| 6 | $250.14 | $14.52B | $160.4M | +59.75% | 126+ days | ||
| 7 | $195.85 | $21.23B | $450.5M | +58.44% | 126+ days | ||
| 8 | $48.96 | $22.36B | $483.0M | +56.57% | 126+ days | ||
| 9 | $230.09 | $30.99B | $307.1M | +53.34% | 126+ days | ||
| 10 | $76.58 | $14.19B | $211.6M | +49.69% | 126+ days | ||
| 11 | $233.08 | $14.40B | $235.7M | +48.61% | 126+ days | ||
| 12 | $118.64 | $16.55B | $205.1M | +47.36% | 126+ days | ||
| 13 | $135.05 | $35.51B | $602.2M | +47.16% | 126+ days | ||
| 14 | $22.25 | $11.52B | $92.9M | +47.06% | 126+ days | ||
| 15 | $333.25 | $15.91B | $326.1M | +46.02% | 126+ days | ||
| 16 | $32.22 | $12.65B | $197.7M | +45.86% | 126+ days | ||
| 17 | $82.43 | $20.18B | $522.7M | +43.33% | 126+ days | ||
| 18 | $277.20 | $46.70B | $460.7M | +43.13% | 126+ days | ||
| 19 | $100.74 | $33.91B | $565.6M | +42.39% | 126+ days | ||
| 20 | $945.53 | $99.08B | $676.1M | +42.30% | 126+ days | ||
| 21 | $271.34 | $22.45B | $214.4M | +41.07% | 126+ days | ||
| 22 | $216.08 | $58.68B | $347.1M | +39.51% | 126+ days | ||
| 23 | $648.51 | $27.38B | $301.6M | +39.12% | 126+ days | ||
| 24 | $50.06 | $11.58B | $176.3M | +38.86% | 126+ days | ||
| 25 | $43.62 | $13.21B | $100.1M | +38.30% | 126+ days |
Strategy methodology and data limitations
The strategy applies: a $10B estimated capitalization floor and average close × volume of $50M/day over up to 63 observations. “Eligible” requires 126 observations; stocks with shorter histories can still pass, under this strategy. Return = close[-1] / close[-90] − 1: 90 observations spanning 89 intervals.
*Estimated historical market cap = Nasdaq cap at fetch time × as-of price / latest fetched price. Ranking-table capitalization uses the fetched Nasdaq value; this strategy estimate is shown separately.
894 candidates · 55 excluded · 3 fetch failures. As-of cutoff: 2026-11-18. Data are snapshots, not streaming quotes. Daily bars are unadjusted; splits, dividends and share-count changes can affect returns and cap estimates. Historical results use today’s universe and contain survivorship bias.
Download full JSON export ↓CONNECTED BY POSSIBILITY
Sector Constellations
Every company belongs to a bigger picture. Explore its orbit.
R.A. 23h 08m DEC. +61° 32′