Learn
Dollar-cost averaging: the answer to 'when should I buy?'
Nvidia fell as much as 14% on Thursday after its chief executive resigned, then recovered. Days like this ask every ordinary investor the same question: when should I buy? Dollar-cost averaging removes the question entirely — here is how it works, with six months of real SPY prices to show it.
Thursday 12 November was the kind of day that makes ordinary investors ask the worst possible question: is now the right time to buy? The S&P 500 fell 0.35% to 7,592.40, the Nasdaq Composite slipped 0.39% to 25,366.09 and the Dow lost 0.36% to 52,297.09. Nvidia fell 4.34% to $166.19 after chief executive Jensen Huang resigned — at one point in the morning it was down 14.35% at $148.80, before recovering most of the loss. Its rivals went the other way: AMD rose 5.86% and Broadcom 5.54%. The 10-year Treasury yield climbed to 5.10% after a hotter-than-expected October inflation reading.
Watch a day like that and the temptation is obvious: wait for the dust to settle, wait for a better price, wait until things feel safe. The problem is that the feeling never arrives on schedule — and while you wait, the market moves without you. Dollar-cost averaging is the simplest answer to that trap. It does not try to pick the right day. It removes the decision entirely.
What dollar-cost averaging is
Dollar-cost averaging means investing a fixed amount of money on a fixed schedule, whatever the price is doing. Five hundred dollars on the first trading day of every month, for example — into the same fund, month after month, in good markets and bad.
The mechanics do the work for you. When the price is low, your fixed $500 buys more shares. When the price is high, the same $500 buys fewer shares. You never decide whether today is cheap or expensive; the arithmetic decides, and it always buys more at lower prices — which is the exact opposite of what most investors do when they follow their feelings.
It is not a way to beat the market. It is a way to make sure you are in the market, steadily, without needing to be right about timing.
A real example: six months of $500 into SPY
Take the SPDR S&P 500 ETF, SPY, the fund that tracks the US market. Suppose an investor put $500 into it on the last trading day of each month from May to October 2026. Here is what actually happened, using SPY's real closing prices:
| Month | SPY close | $500 bought |
| --- | --- | --- |
| 29 May | $756.48 | 0.661 shares |
| 30 Jun | $746.77 | 0.670 shares |
| 31 Jul | $747.03 | 0.669 shares |
| 31 Aug | $767.05 | 0.652 shares |
| 30 Sep | $762.63 | 0.656 shares |
| 30 Oct | $755.72 | 0.662 shares |
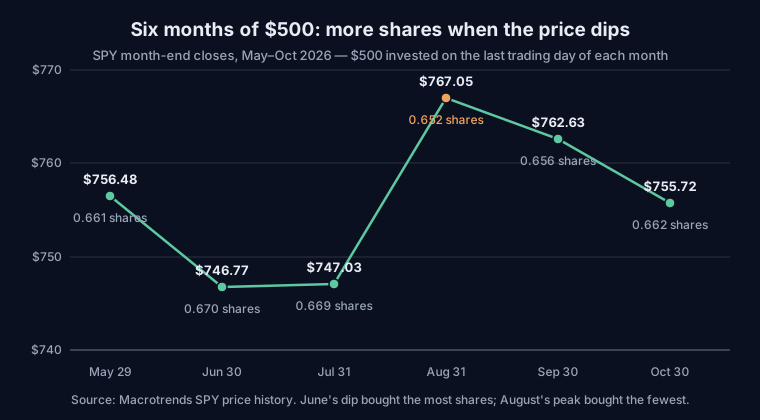
The pattern is visible in the chart: June's dip to $746.77 bought the most shares (0.670), and August's peak of $767.05 bought the fewest (0.652). Nobody had to predict either move — the fixed monthly amount did it automatically.
Add it all up: $3,000 invested, 3.969 shares owned, at an average cost of $755.87 per share. Notice that this is slightly below the simple average of the six prices ($755.95) — because more shares were bought at the lower prices, the average cost is pulled down. At Thursday's close of $757.12, the holding was worth $3,004.95, a gain of 0.16%.
Now compare with putting the whole $3,000 in at once on 29 May: that would have bought 3.966 shares, worth $3,002.54 on Thursday — a gain of 0.08%. The difference is $2.41. In other words, over these six flat months, dollar-cost averaging and investing everything at once ended in almost exactly the same place. SPY spent the whole period inside a narrow band, from $746.77 to $767.05 — a range of just 2.7% — so there was barely any dip to take advantage of.
That is the honest result, and it matters: dollar-cost averaging is not a return booster. Its value shows up in two other places — in falling markets, where it keeps buying cheaper and cheaper, and in the investor's own behaviour, where it replaces a stressful decision with a routine.
Why it works: it fixes the investor, not the market
The real problem dollar-cost averaging solves is not mathematical. It is that buying is easy when prices are rising and almost impossible when they are falling — which is exactly backwards. After a day like Thursday, when Nvidia has dropped 14% intraday and the headlines are full of resignations and inflation, most people's instinct is to wait. But waiting is itself a timing decision, and it is usually made at the worst moment: after the fall, not before it.
A fixed schedule takes that decision off the table. The money goes in on the first of the month whether the news is good or bad, whether you feel brave or nervous. Over years, that discipline matters more than any single entry price — because the investors who do worst are rarely the ones who bought at the wrong price. They are the ones who stopped buying altogether, or who waited years for a "safe" moment that never came.
There is a second, quieter benefit: it turns volatility from something to fear into something useful. When prices fall, your fixed amount buys more shares. A 20% fall is not just a loss on what you already own — it is a 25% discount on what you buy next. That only helps if you keep buying, which is why the schedule matters more than the amount.
What beginners get wrong
Thinking it guarantees a profit. It does not. If the market falls and stays down, regular buying still loses money — it just loses it more slowly and at a lower average cost. Dollar-cost averaging reduces timing risk, not market risk.
Expecting it to beat investing everything at once. In a market that mostly rises, putting all the money in immediately usually ends ahead, because more of it is invested for longer. The six-month example above shows the two approaches finishing within $2.41 of each other. The case for averaging is not higher returns — it is that most people cannot bring themselves to invest a large sum at once, and averaging is how they actually get invested instead of waiting forever.
Stopping when the market falls. This is the most expensive mistake of all, because it breaks the mechanism at the exact moment it is most valuable. The months when buying feels worst are the months when your fixed amount buys the most shares. Pausing in a downturn turns dollar-cost averaging into its opposite: buying only when prices are high.
Averaging into a single shaky stock. Dollar-cost averaging does not fix a bad investment. Nvidia is down 31% from its record close of $239.24 on 6 October — a regular buyer would have kept buying all the way down, and would still be heavily down. The technique works best with a diversified fund, like the S&P 500 ETF in the example, where a fall is a market event rather than a single company's problem. It removes timing risk; it does nothing about the risk of one company.
Waiting for a dip before starting. "I'll start when prices drop a bit" is market timing wearing a different coat. If you have money to invest regularly, the schedule starts now — the dips will come to you.
What to watch next
October's Producer Price Index arrives at 08:30 ET on Friday, the last big inflation reading before the Federal Reserve meets on 8–9 December. Then the date that matters most for this week's story: Nvidia reports third-quarter results after the close on Tuesday 17 November, with an interim chief executive and a stock that has already swung 14% in a single day. Anthropic is expected to price its IPO on Wednesday 18 November, and Alibaba reports results on Thursday 19 November.
Whatever those days bring, the lesson of dollar-cost averaging is the same: you do not need to know what Thursday will do to the market. You need a fixed amount, a fixed date, and the discipline to keep both when the headlines are at their worst. The market will provide the volatility. The schedule provides the rest.
This article is for education only. It is not financial advice.