Learn
ETFs vs stocks: buying one company or the whole market?
Nvidia fell 4.12% on Monday while the S&P 500 fell 1.92% — the same bad day, felt very differently depending on what you owned. An ETF buys the whole basket; a stock buys one company. Here is how they differ, what each one costs, and what beginners get wrong.
Monday 16 November was a sharp reminder that what you own matters as much as which way the market moves. The S&P 500 fell 1.92% to 7,416.59, the Nasdaq Composite dropped 2.49% to 24,509.76 — now more than 10% below its 6 October high, which puts it in a correction — and the Dow lost 1.41% to 51,608.17. It was the third straight down day for the S&P 500 and the Nasdaq. The trigger was a new US rule requiring licences for advanced AI chips shipped to data centres in five countries, and chipmakers took the worst of it: the PHLX Semiconductor Index fell 5.28%, and Nvidia (NVDA) dropped 4.12% to $156.14, its lowest close since 1 July 2025, the day before it reports third-quarter results.
An investor who owned only Nvidia felt the full 4.12%. An investor who owned the whole market through an index fund felt 1.92%. That gap — one company versus the whole market — is the difference between a stock and an ETF. It is the first choice most ordinary investors face, and it is worth understanding properly.
What a stock is
A share of stock is a slice of one company. When you buy Nvidia, you own a piece of Nvidia's business: its chips, its customers, its lawsuits, its chief executive's resignation last week and the questions about who runs the company next. Your return is that company's return, for better and for worse.
That concentration cuts both ways. Nvidia's record close was $239.24 on 6 October; at Monday's $156.14 it is about 35% below that high. A single company can fall by a third in six weeks while the market as a whole falls far less — because one company's problems are not the market's problems. The reverse is also true: one company can double while the market goes nowhere. A stock is a bet on a story. The story can be right, and it can be wrong, and you feel all of it.
What an ETF is
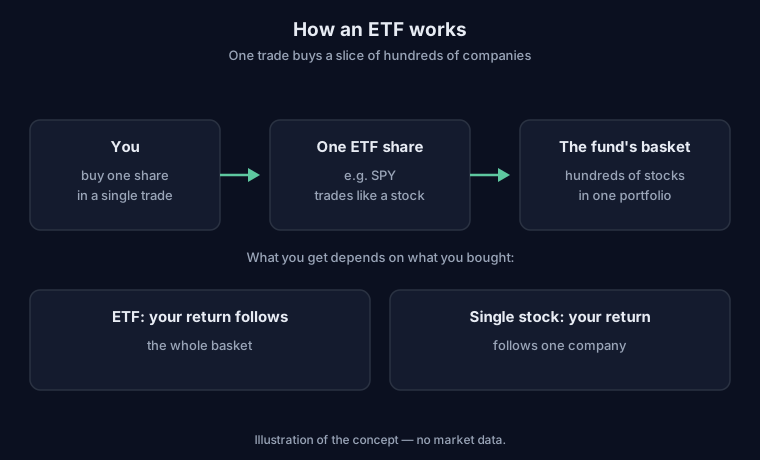
An exchange-traded fund is a fund that holds a basket of stocks and trades on an exchange, just like a single stock. The best-known example is the SPDR S&P 500 ETF Trust (SPY), which holds the roughly 500 companies in the S&P 500 index. Buy one share of SPY and you own a small slice of all of them at once — in proportion to their size.
The price of the ETF follows the basket. When the S&P 500 fell 1.92% on Monday, SPY fell about the same amount — not because any one company fell that much, but because the average of 500 companies did. You give up the chance of picking the one stock that doubles. In exchange, you give up the risk of holding the one stock that falls by a third.
The cost gap: what the basket charges
An ETF charges an annual fee, the expense ratio, taken as a small percentage of the money invested. The size of that fee is where ETFs earn their reputation — and where the gap between funds is widest.
Morningstar's 2026 US Fund Fee Study, using 2025 data, puts the asset-weighted average expense ratios like this: broad index funds charge 0.09% a year, strategic-beta funds 0.16%, and actively managed funds 0.57%. The average across all funds is 0.32%.
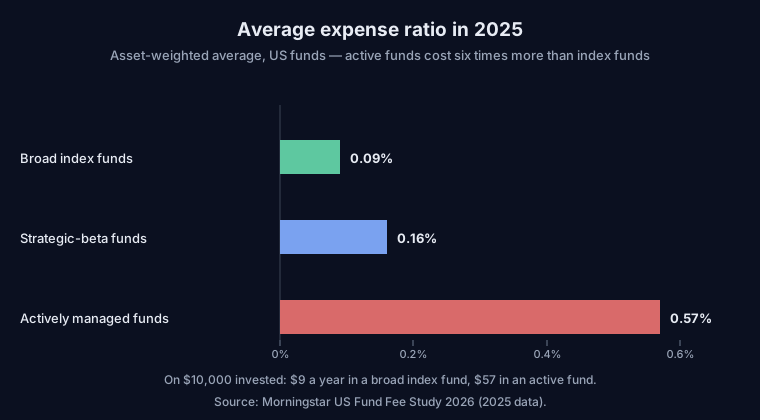
Put in dollars: on a $10,000 investment, a broad index fund costs about $9 a year. An actively managed fund costs about $57. The fee is charged every year, in good years and bad, whether the fund beats the market or not — and it compounds. A gap of roughly half a percentage point a year, repeated over twenty or thirty years, is one of the largest predictable differences in an ordinary investor's returns.
Fees matter so much because they are one of the few things about investing that are predictable. Morningstar's research has consistently found that a fund's expense ratio is among the most reliable predictors of its future relative performance: the cheapest funds have the best odds of surviving and outperforming their pricier peers. That is not a guarantee about any single fund. It is a statement about the odds — and the odds favour the cheap basket.
Do the stock-pickers beat the basket?
The obvious objection is that a skilled manager picking individual stocks should beat a basket that simply owns everything. The record says otherwise, most of the time.
Morningstar's Active/Passive Barometer, which tracks thousands of funds, found that in 2025 only 38% of actively managed funds both survived the year and outperformed their passive peers. Over the decade ending 31 December 2025, only 21% managed it. In other words, about four out of five active funds failed to beat the basket over ten years — after fees.
That does not mean nobody beats the market. It means beating it is hard, and that the fees make it harder: every fund starts each year behind its benchmark by the amount of its expense ratio, and has to earn that back before it can get ahead. The basket does not have to be clever. It just has to be cheap.
How big ETFs have become
Investors have noticed. US ETF assets stood at $16.27 trillion at the end of August 2026, spread across 5,274 funds, according to the Investment Company Institute — up from $2.1 trillion in 2015 and $13.4 trillion at the end of 2025. About 19.8 million US households, roughly 15%, owned ETFs in 2025.
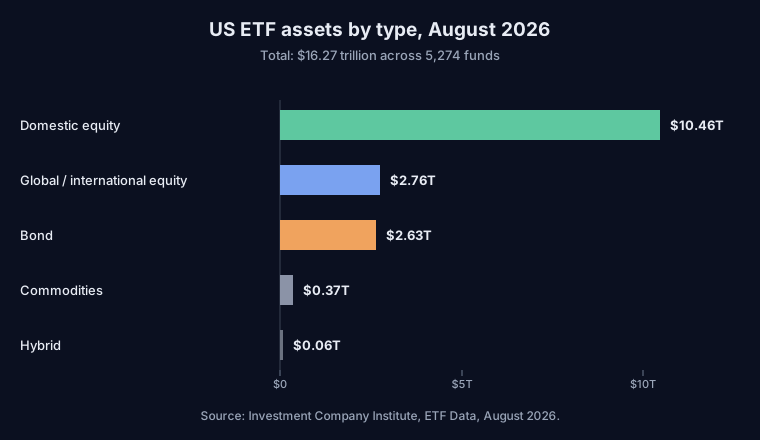
Domestic equities are the bulk of it — $10.46 trillion of the $16.27 trillion — followed by global equities at $2.76 trillion and bonds at $2.63 trillion. The growth is not just about size. It is a shift in how ordinary people invest: from picking stocks to buying the market, in one trade, at a known price, during market hours.
Stock or ETF? A quick comparison
| | One stock | An ETF |
| --- | --- | --- |
| What you own | A slice of one company | A slice of a whole basket |
| Diversification | None — one story | Built in — hundreds of companies |
| Typical annual cost | Nothing beyond the trade | 0.09% for a broad index fund, 0.57% for an active fund |
| Best case | One company doubles | The market rises steadily |
| Worst case | One company falls by a third | The market falls — but rarely by a third |
| Suits | Investors with a researched view on one business | Investors who want the market's return |
What beginners get wrong
Thinking an ETF cannot lose money. It can. An ETF that tracks the S&P 500 falls when the S&P 500 falls — 1.92% on a day like Monday, and much more in a real bear market. What it cannot do is fall 35% because one chief executive resigned. Diversification removes the single-company risk, not the market risk.
Treating a sector ETF as diversified. A fund that holds only chipmakers is not the market — it is a bet on chips, and it falls with chips. The PHLX Semiconductor Index fell 5.28% on Monday; a semiconductor ETF would have felt most of that. Diversification means owning many kinds of companies, not many companies in one industry.
Ignoring the expense ratio. The difference between 0.09% and 0.57% looks trivial on a statement. Over decades it is not. Before buying any fund, check the fee — it is the one cost you can control, and it is charged whether the fund performs or not.
Trading an ETF like a stock. An ETF trades all day, so it is tempting to trade it all day. But the point of buying the whole market is to hold the whole market. Every trade adds cost and a timing decision, and the basket's advantage is precisely that it needs neither.
Assuming last year's winning ETF repeats. The best-performing fund of one year is rarely the best of the next. Chasing last year's winner — usually a narrow, fashionable theme — is stock-picking with extra steps.
What to watch next
Nvidia reports third-quarter results after the close on Tuesday 17 November, with an interim chief executive and a stock already about 35% below its record high. Anthropic is expected to price its IPO on Wednesday 18 November, and Alibaba reports results on Thursday 19 November. The Federal Reserve meets next on 8–9 December.
Whatever those days bring, the question in this article stays the same: do you want one company's story, or the market's? A stock can make you rich and can cost you a third of your money in six weeks. An ETF will never do either. For most ordinary investors, that trade — giving up the biggest wins to give up the biggest single losses — is the whole point.
This article is for education only. It is not financial advice.
Sources
- Swingfolio: US Close 16 Nov 2026 — S&P 500 -1.92% as New AI Chip Export Rule Sends Chipmakers Down 5.28%
- Morningstar: US Fund Fee Study 2026 (PDF)
- Morningstar Active/Passive Barometer 2025 — 38% of active funds beat passive peers; 21% over a decade
- Investment Company Institute: Exchange-Traded Fund Data, August 2026