Learn
The P/E ratio: what you're really paying for a dollar of earnings
Hot inflation pushed the 10-year yield to 4.98% on Tuesday, and the stocks that fell hardest were the expensive ones. The P/E ratio is the tool that tells you what 'expensive' means — price divided by earnings.
On Tuesday 10 November, October CPI rose 0.4% against a 0.3% forecast, core CPI came in at 0.3% against 0.2% expected, and the 10-year Treasury yield climbed to 4.983% after touching 5.021% during the session. The S&P 500 fell 0.38% to 7,520.93, the Nasdaq dropped 0.74% to 25,065.88 and the Dow lost 0.30% to 52,231.89. But the damage was not spread evenly: Nvidia fell 5.47% to $168.89, down about 10% over two sessions, and Microsoft fell 2.20%, while Broadcom rose 3.91%.
Days like this are when one number does most of the explaining. The price-to-earnings ratio — the P/E — is the market's standard way of saying how expensive a stock is, and it is also the reason rising interest rates hurt some stocks far more than others.
What the P/E ratio is
The P/E ratio divides a company's share price by its earnings per share (EPS). A stock trading at $100 with earnings of $5 per share over the past year has a P/E of 20. In plain terms, investors are paying $20 for every $1 of annual earnings the company produces.
That is all the ratio is: a price tag measured against what the business actually earns. A share price on its own tells you nothing about value — a $500 stock can be cheap and a $20 stock can be expensive. The P/E puts the price next to the earnings, so two very different stocks can be compared on the same footing.
Flip the ratio over and you get the earnings yield: earnings divided by price. A P/E of 20 means an earnings yield of 5% — the business earns 5 cents a year for every dollar you pay for it. That number can be compared directly with a bond yield, which is exactly what the market did on Tuesday: the S&P 500's forward earnings yield stood at 5.56% on 9 November against a 10-year Treasury yield of 4.98% on Tuesday, so the gap between owning stocks and owning government bonds narrowed as yields rose.
Trailing P/E vs forward P/E
There are two versions of the ratio, and they answer different questions.
The trailing P/E uses earnings from the past 12 months — money the company has already made. It is a fact, but it looks backwards. The forward P/E uses analysts' estimates for the next 12 months — money the company is expected to make. It looks forwards, but it depends on forecasts that can be wrong.
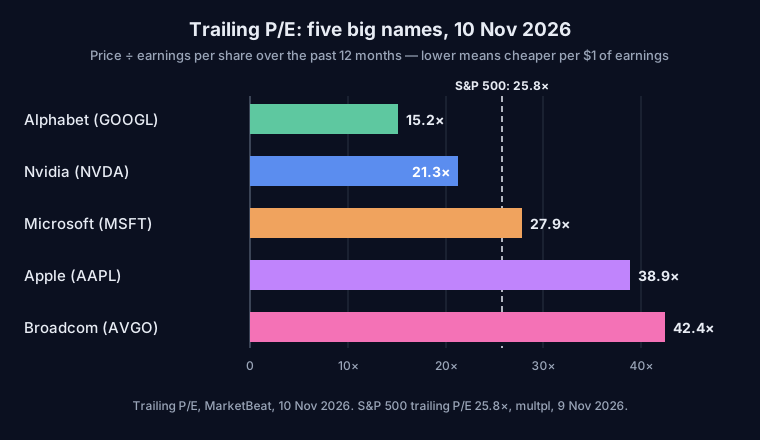
The gap between the two is often the most interesting thing about a stock. Nvidia's trailing P/E is 21.3 times, but its forward P/E is 10.7 times — about half. That is not a contradiction: it means analysts expect Nvidia's earnings to grow so fast that the price looks much cheaper against next year's earnings than against last year's. Apple's numbers run the other way: a trailing P/E of 38.9 times and a forward P/E of 32.2 times, so the market is paying far more per dollar of earnings, and expecting slower earnings growth to close the gap. Microsoft sits in between, at 27.9 times trailing and 22.4 times forward.
What the market is paying today
The S&P 500 as a whole trades at 25.75 times trailing earnings, against a long-run average of 16.24 going back to 1871. On forward earnings it trades at 17.7 times, below its 10-year average of 19.1 and above its 25-year average of 16.4. The Shiller CAPE — the price divided by ten years of inflation-adjusted earnings — stands at 39.85, more than twice its long-run mean of 17.45.
Read together, those numbers say the market is expensive against its own history on past earnings, but less stretched once you allow for the earnings growth analysts expect. That is the whole debate about this market in one ratio: the bulls are buying the forward number, the bears are pointing at the trailing one.
Why rising rates hit high P/E stocks hardest
Tuesday is a textbook example. When the 10-year yield jumps, every future dollar of earnings is worth less in today's money — and that discounting bites hardest where most of the value sits in the distant future. A company trading at 40 times earnings is priced on profits years away; a company at 15 times earnings is priced mostly on the profits it makes now. So when yields rose, the high-multiple growth names fell furthest — Nvidia down 5.47%, Microsoft down 2.20% — while the broader market fell only 0.38% and the financial sector, which benefits from higher rates, actually rose 0.52%.
This is also why the P/E is a useful first filter and nothing more. It tells you what the market expects, not whether the market is right.
What beginners get wrong
Treating a low P/E as a bargain. A low multiple often means the market expects earnings to fall, or the business to shrink. A stock at 10 times earnings is cheap only if those earnings survive. Alphabet trades at 15.2 times trailing earnings — the cheapest of the five names in the chart — but that says as much about what investors doubt as about what they are paying.
Treating a high P/E as a bubble. A high multiple often means the market expects earnings to grow fast. Nvidia's forward P/E of 10.7 times shows the other side of the same coin: yesterday's expensive stock becomes today's cheap one if the earnings arrive. The multiple is a claim about the future, and the future has to deliver.
Comparing P/Es across different industries. A software company and an oil refiner should not trade at the same multiple — their growth rates, margins and capital needs are different. Compare a stock with its own history and with its direct peers, not with the whole market.
Using one version and ignoring the other. Trailing P/E alone misses a turnaround; forward P/E alone trusts a forecast. The honest picture needs both, plus the question neither can answer: are the earnings real, repeatable cash profits, or a one-off?
What to watch next
Nvidia reports third-quarter results on Tuesday 17 November, and that report is the next test of the earnings behind its multiple — the forward P/E of 10.7 times only holds up if the earnings growth analysts expect actually arrives. Before that, October PPI lands at 08:30 ET on Friday 13 November, the next inflation reading after a hot CPI. If it is hot too, yields stay high and high-multiple stocks stay under pressure; if it cools, the market gets room to look at the forward numbers again.
A P/E ratio will never tell you whether to buy a stock. It tells you what you are paying, what the market expects in return, and how much of the price depends on a future that has not happened yet. That is a smaller promise than most market commentary makes — and a more useful one.
This article is for education only. It is not financial advice.
Sources
- Swingfolio: US Close 10 Nov 2026 — S&P 500 -0.38% on Hot CPI; Nvidia -5.47%
- MarketBeat: Compare Stocks — AAPL, AVGO, MSFT, NVDA, META trailing and forward P/E, 10 Nov 2026
- MarketBeat: Compare Stocks — AAPL, MSFT, NVDA, GOOGL, TSLA, AMZN trailing and forward P/E, 10 Nov 2026
- Exent: Is the S&P 500 Overvalued Right Now? — trailing P/E 25.75, forward P/E 17.7, CAPE 39.85, updated 10 Nov 2026
- DollarLiquidity: S&P 500 Forward P/E — 17.99×, 5.56% earnings yield, 9 Nov 2026